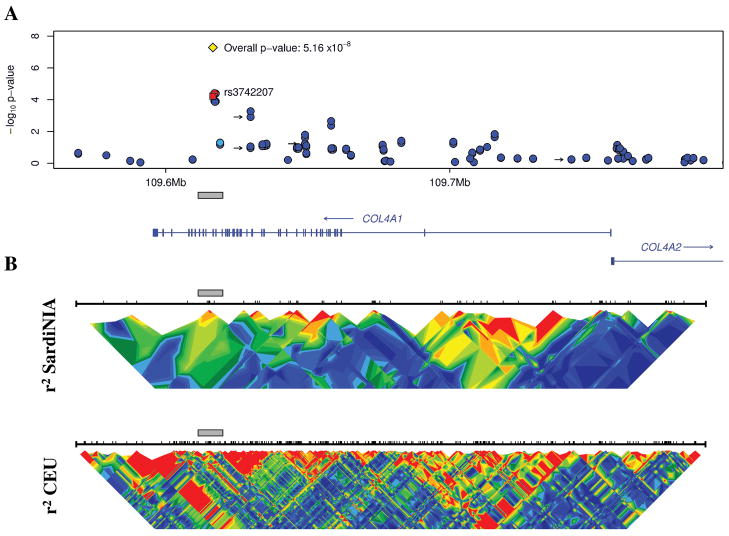
Figure 3.
A) Summary of the association with PWV in the COL4A1 region in the SardiNIA study. Dots represent all the markers in this region that were analyzed, colored according to their linkage disequilibrium (r2) with rs3742207, which is represented by a red square. LD coloring ranges from red (high LD), to green (moderate LD), to blue (low LD). The yellow diamond indicates the overall p-value for rs3742207 obtained from combining the results of SardiNIA, SardiNIA Stage 2 and HAPI Heart. Black arrows denote markers that were also analyzed by the Framingham Heart Study12, and they are from left to right: rs2131939, rs10492497, rs496916 and rs2391823. B) A summary of the patterns of disequilibrium in the SardiNIA study cohort and in the CEU (Utah residents with ancestry from Northern and Western Europe) HapMap population, 22 where r2 values are calculated as described23 and colored as in panel A. The gray bar marks the region of association and facilitates comparisons among the panels.

