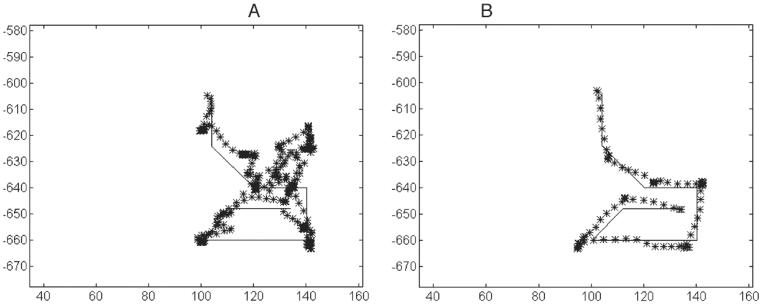
Figure 2.
Examples of the measured walking trajectories. A. An example of a particularly poor performance, in which the participant walked 115.2 meters (378 feet) for a 50-meter (164-foot) path. B. An example of a particularly good performance, in which the participant walked 59.4 meters (about 195 feet) for the same 50-meter (164-foot) path. The solid line represents the intended path, and the asterisks represent the walked path.

