Figure 1.
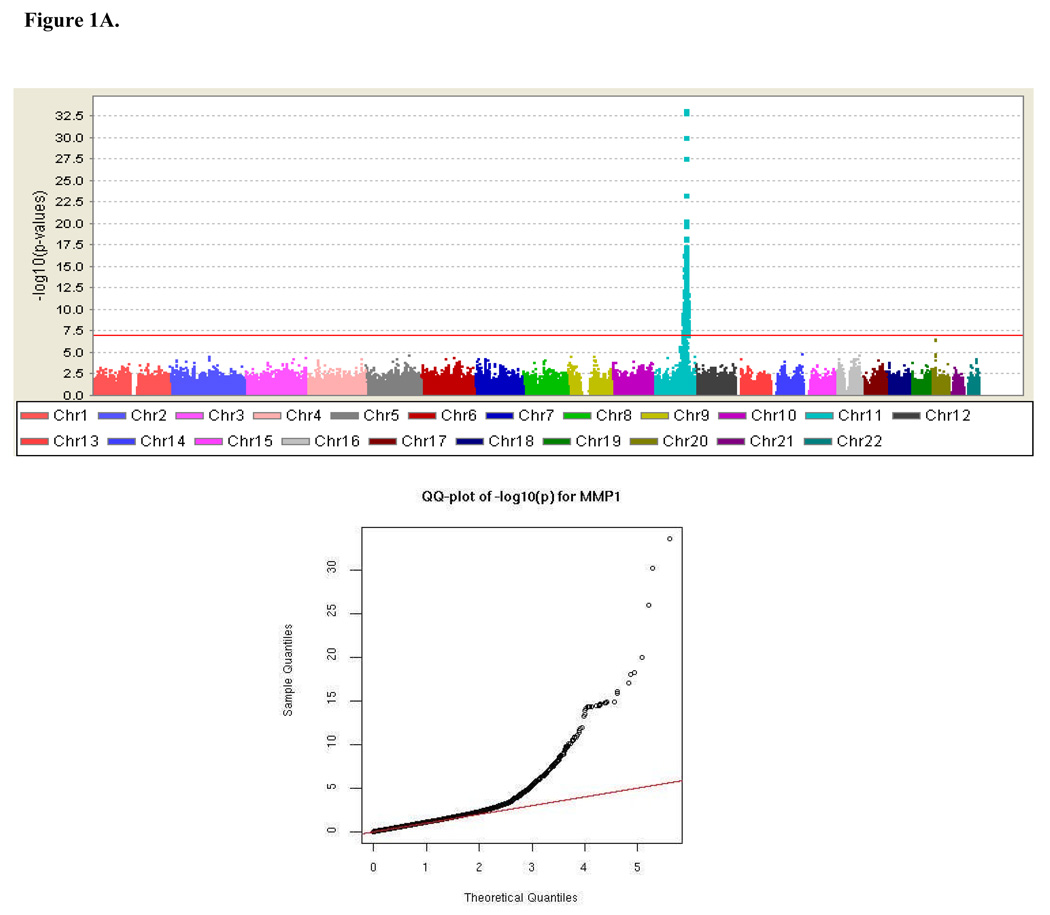
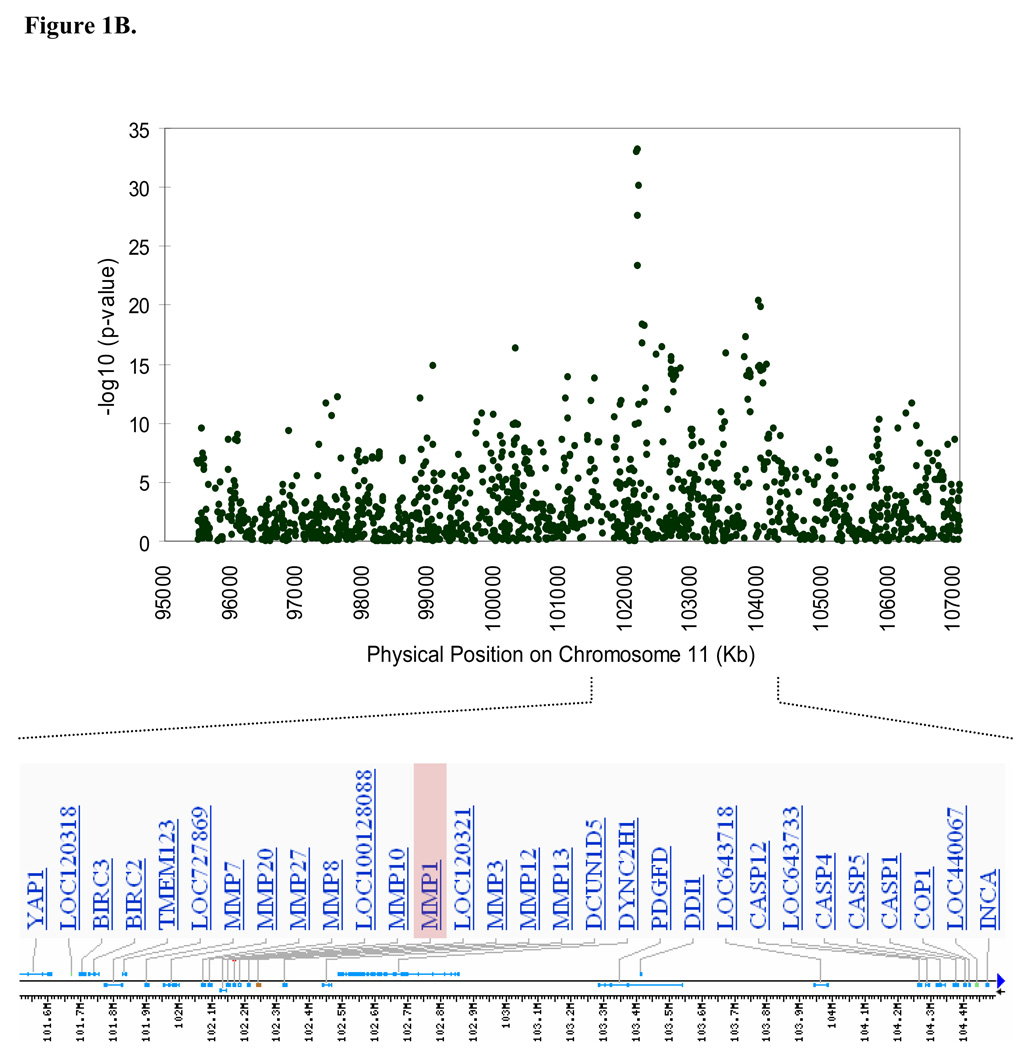
Genome-wide association results. (A) Negative log of p-values and a quantile-quantile (Q-Q) plot showing the association of single nucleotide polymorphisms (SNPs) with MMP-1 serum levels across the entire genome using mixed model variance components analysis, and (B) Association signals and genes present in the region of significance on chromosome 11.


