
Figure 1. Geographic distribution of hospitals, firehouses and patients with cardiac symptoms who called 911 in 2004.
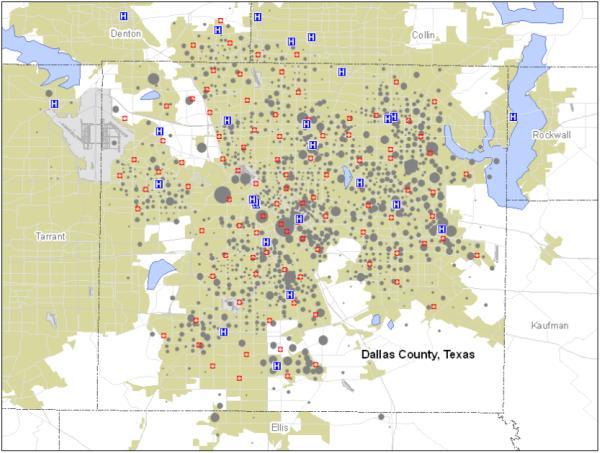
Hospitals are represented by a blue “H”. Firehouses with emergency medical service (EMS) facilities are represented by a red cross. Patient calls (N=5,887) are represented by shaded circles and are scaled in size to represent the number of calls, ranging from 1 to 97 calls from any single Census block group.