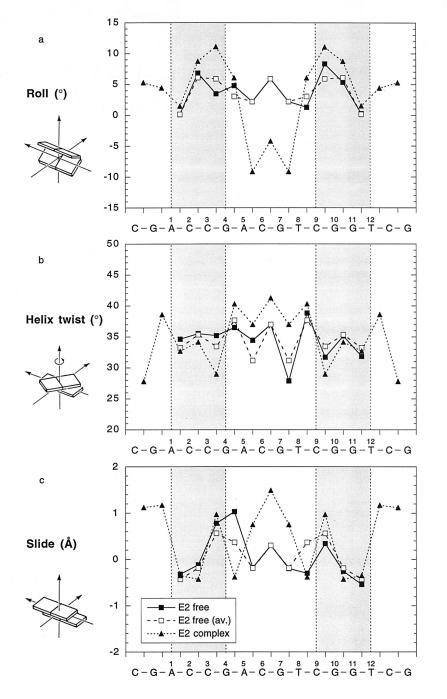
Figure 5.
Comparison of local parameters between the free E2 dodecamer (■) and the bound E2 16-mer (▴). End-to-end average values of the free dodecamer are also shown (□). Parameters shown are roll (a), helix twist (b), and slide (c). The parameters were derived by freehelix (15) The various definitions are given in Table 2 and indicated by the corresponding drawings at the left. The consensus ACCG/CGGT regions are shaded.

