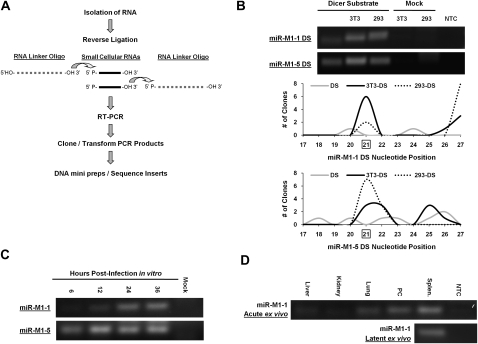
FIGURE 3.
Detection of mature miRNAs using RLM-RT-PCR. (A) Schematic of the RLM-RT-PCR process for the detection of mature miRNAs. (B) RLM-RT-PCR of miRNAs miR-M1-1 and miR-M1-5 produced from the dicer substrates in transfected cells. Total RNA from the indicated cell types was used as template for the RLM-RT-PCR procedure. RT-PCR products were resolved by gel electrophoresis and visualized by ethidium bromide. Histogram representation of sequence analysis of the RT-PCR products from the dicer substrates is shown below the agarose gels. Each dicer substrate RLM-RT-PCR product in B was cloned, and 10 clones of each product were sequenced. The histograms show the position where the dicer substrate molecule ligated to the RNA linker oligo. Nucleotide position 21 is the predicted dicer cleavage site for these molecules and is boxed. Clones that yielded primer dimer products are not represented in the histogram. The gray lines represent clones sequenced from the untransfected dicer substrates. The solid black line represents clones sequenced from dicer substrates transfected into 3T3 cells. The dotted black line represents clones sequenced from dicer substrates transfected into 293 cells. (C) RLM-RT-PCR analysis of mature γHV68 miR-M1-1 and miR-M1-5 from γHV68 infected samples. Lytic in vitro RLM-RT-PCR products were amplified from RNA samples of 3T3 cells infected at an MOI = 5 with total RNA isolated at 6, 12, 24, and 36 h post infection. (D) Acute and latent ex vivo RLM-RT-PCR products were amplified from RNA of C57BL/6J mouse tissues collected at day 5 post-infection (acute) or day 16 post-infection (latent). All RLM-RT-PCR products were resolved and visualized using ethidium bromide staining. Bands were confirmed to be mature miR-M1-1 miRNAs by cloning and sequencing. Splen. indicates splenocytes cells; PC, peritoneal cells.

