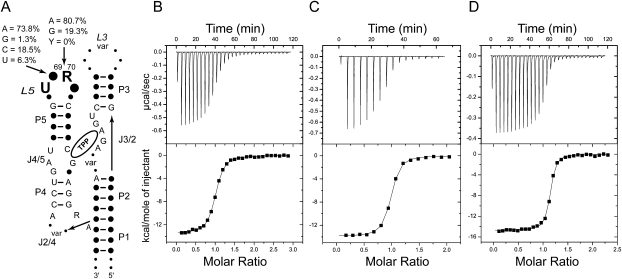
FIGURE 5.
ITC analysis of the L3–P5 interaction. (A) Schematic representation of phylogenetic sequence conservation of the thi-box riboswitch aptamer domain. (Solid circles, “var”) Variable positions. A summary of the analysis of 500 sequences from the Rfam database (Gardner et al. 2009) is given for positions 69 and 70. (B) Representative ITC experiment analyzing binding of TPP to E. coli thiM aptamer domain mutant A69C. (C) TPP titration of mutant A69U. (D) TPP titration of mutant A70G. All experiments were performed in the presence of 10 mM Mg2+.

