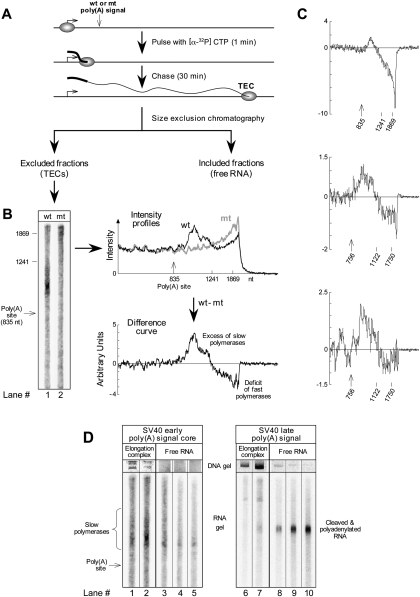
FIGURE 1.
Survey of paused polymerases by transcript analysis. (A) Experimental protocol. DNA from Reporter 3 was transcribed in vitro using a pulse-chase format very similar to that of Rigo et al. (2005), and then TECs were isolated by size fractionation in the presence of 1 M NaCl and 1% Sarkosyl. A fourfold increase over the typical reaction size was used. The length of the pulse was chosen to be short enough to preclude any polymerases from reaching the poly(A) site before the start of the chase. (B) Comparison of TEC fractions for wild-type and mutant versions of the reporter. Size calibrations are based on RNA transcribed from the same or similar template in the presence of complementary DNA oligonucleotides that direct RNase H to cut the RNA at specified locations (Rigo et al. 2005). TECs (identified by the presence of plasmid DNA) eluted from the column in fractions 8 and 9 for the wild type and in fractions 7 and 8 for the mutant. Gel lanes 1 and 2 show column fractions 9 and 8, respectively. However, the intensity profiles to the right of the gel show the summed intensities for both TEC fractions eluting from the column. In preparing these profiles, the data were background corrected and normalized, as described below, to control for variations in the amount of template used in the different transcription reactions and for variations in sample recovery. First, the background in the gel above the region containing RNA was subtracted from the signal in all lanes, bringing the far right of the line graphs to zero. Then, the remaining signal in each lane was normalized at each position to the sum of the signal for TECs that had not reached the poly(A) signal. Thus, the average signal to the left of the poly(A) site for each graph is identical, by definition—as it should be, since the wild-type and mutant templates are identical upstream of the poly(A) signal. The difference curve was calculated by subtracting the mutant intensity profile from the wild-type one and expressing the result in arbitrary units related to the fraction of all RNA produced in the experiment. (C) Difference curves from three additional experiments. Reporters 3 and 2a were used for the top panel and for the bottom two panels, respectively. (D) Gel-electrophoretic analysis of RNA and DNA from size fractionated transcription reactions for poly(A) signals that either do not (lanes 1–5) or do (lanes 6–10) process efficiently in vitro. Fractions 8, 9, 11, 12, and 13 are shown for the SV40 early column, and fractions 7, 8, 10, 11, and 12 are shown for the SV40 late column. Transcription and processing of the SV40 late RNA was exactly as described in Rigo et al. (2005) with a 2-min pulse and a 13-min chase. Lane 2 in D is the same as lane 1 in B.

