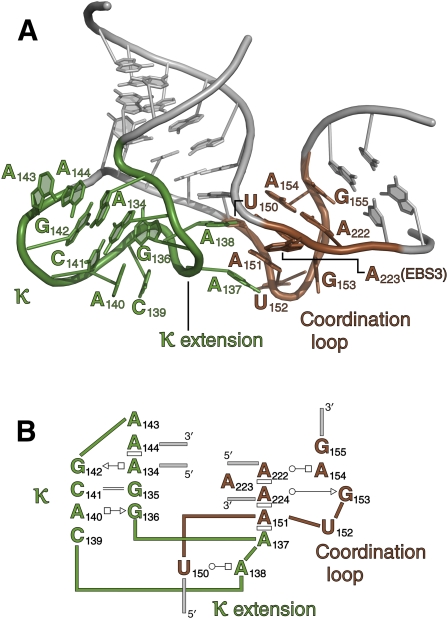
FIGURE 7.
The coordination/κ loop region. Note that κ and the coordination loop are colored differently here than in other figures. (A) Cartoon rendering of this sector. (B) Secondary structure diagram, using symbolic conventions as described in Figure 4.

