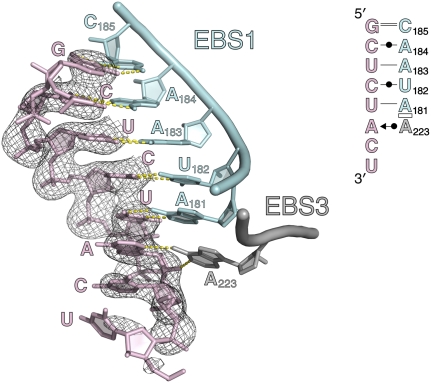
FIGURE 9.
Exon binding to the intron. A cartoon rendering of EBS1 and EBS3 is shown, with the bound oligonucleotide target fragment displayed in pink. A 2FO − FC electron density map is shown for the oligonucleotide and is contoured at 1.0σ. (Inset) A secondary structural diagram of the anticipated oligonucleotide binding mode.

