Figure 7.
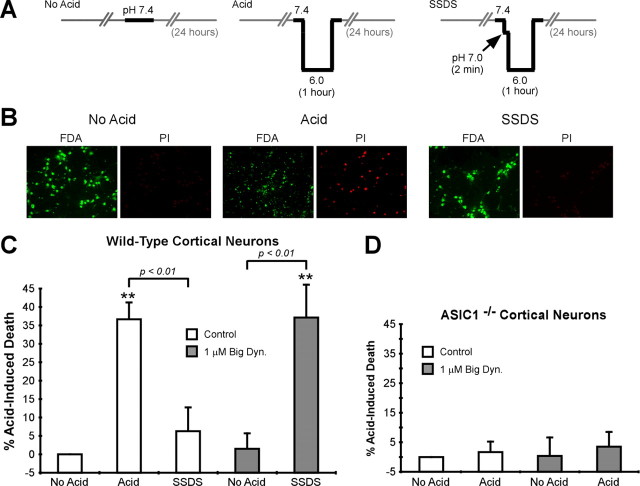
Big dynorphin enhances ASIC1-mediated neuronal death in cortical neurons. A, Schematic of the conditions tested in cortical neuron death assay. Horizontal axis represents time; vertical axis represents pH. Gray lines indicate time in tissue culture medium. Black bars indicate time in artificial extracellular solution during intervention. “SSDS” indicates conditions to stimulate steady-state desensitization before acidosis. Interventions were done in the presence or absence of 1.0 μm big dynorphin. Note that all experiments were done in the presence of excitotoxicity inhibitors, including those which inhibit NMDA receptor activity (see Materials and Methods). B, Representative pictures showing fluorescein diacetate and propidium iodide labeling of neurons following acidosis interventions in the absence of big dynorphin. C, D, Quantification of acid-induced death in wild-type or ASIC1−/− cortical neurons following acidosis interventions. The average baseline cell death was determined in the “No Acid” condition, and “% Acid-Induced Death” represents the percentage of death above baseline following the indicated interventions (n = 6–7, F = 13.97, df: 4,32 for wild-type neurons, n = 3, F = 0.1319, df: 3,8 for ASIC1−/− neurons). Data were compared using a one-way ANOVA. **p < 0.01 compared with “No Acid” control group. Error bars are the SEM. Dyn., Dynorphin.

