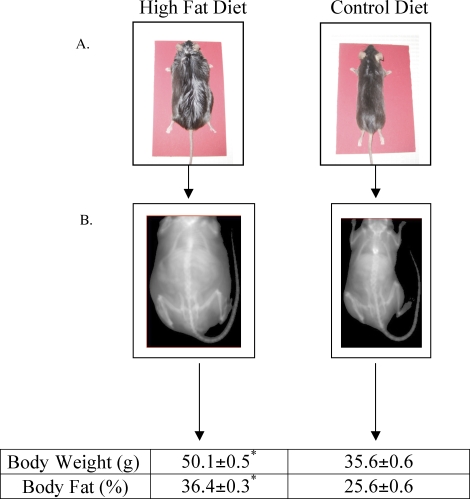
FIG. 1.
Photographs (A) and PIXIMUS (middle) densitometry images (B) of mice at age 30 wk that consumed either the high-fat or control diet since age 5 wk. Average body weight and percent body fat measurements of mice at age 30 wk. *Denotes a statistical difference in mice consuming the high fat vs. control diet at age 30 wk. Data represents the mean ± SEM of 24 male mice per group. Values were considered significantly different at P ≤ 0.05.

