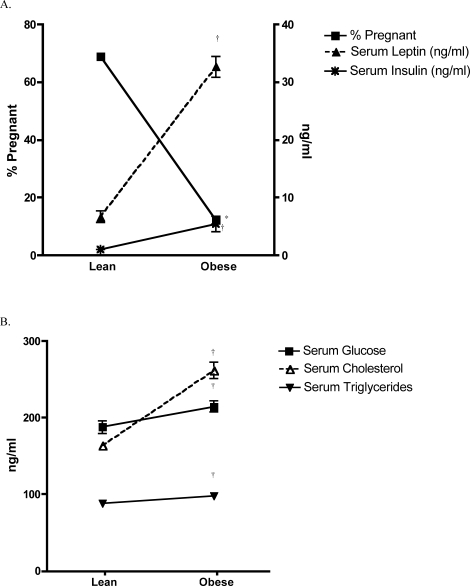
FIG. 4.
A) Comparison of serum leptin and insulin levels in fasted obese and lean male mice at age 30 wk and the percentage of pregnancies resulting from mating with B6C3F1 females. †Denotes a significant increase in serum leptin and insulin in obese vs. lean mice. *Denotes a significant decrease in the percentage of pregnant females mated to obese vs. control males. B) Serum cholesterol, glucose, and triglycerides from fasted obese and lean male mice at age 30 wk. †Denotes a statistical increase of these parameters in fasted obese vs. lean mice. Data represents the mean ± SEM of four to eight male mice per group. Values were considered significantly different at P ≤ 0.05.

