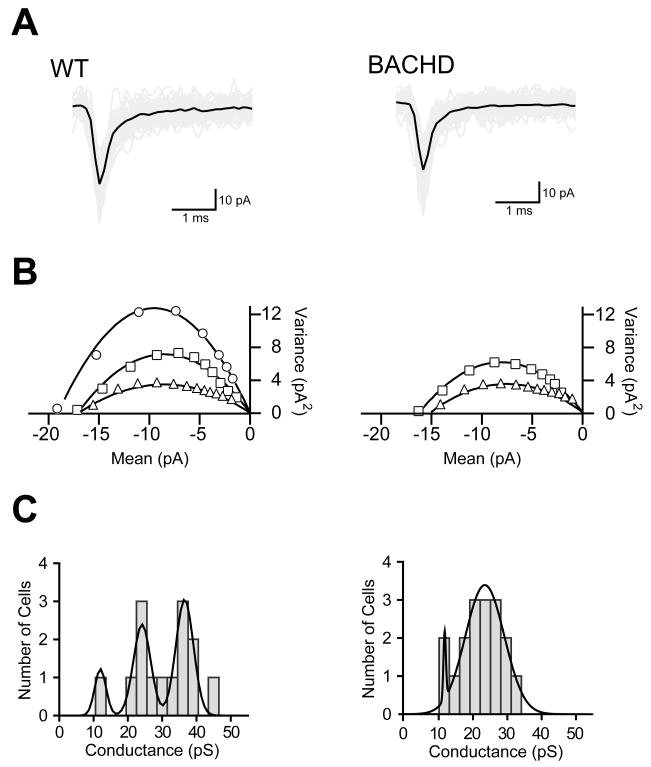
Figure 7. Non-stationary noise analysis of sEPSC onto parvalbumin interneurons in 6 month old BACHD mice.
A Sample spontaneous events that were used to determine the average excitatory global single channel conductance of a given cell are displayed with the raw traces shown in grey and the average in black. B: Sample mean vs. variance plots and parabolic fits demonstrating the three different conductance states observed in WT PV interneurons and the two conductance states observed in BACHD PV interneurons. C: Histograms of the average excitatory global single channel conductance of each WT parvalbumin interneuron illustrating that the cells fall into three primary conductance states corresponding to the peaks of the triple Gaussian fit at 12.0 pS, 24.1 pS, and 36.6 pS; while the BACHD cells were better fit with two Gaussians centered at 12.1 pS and 23.9 pS.

