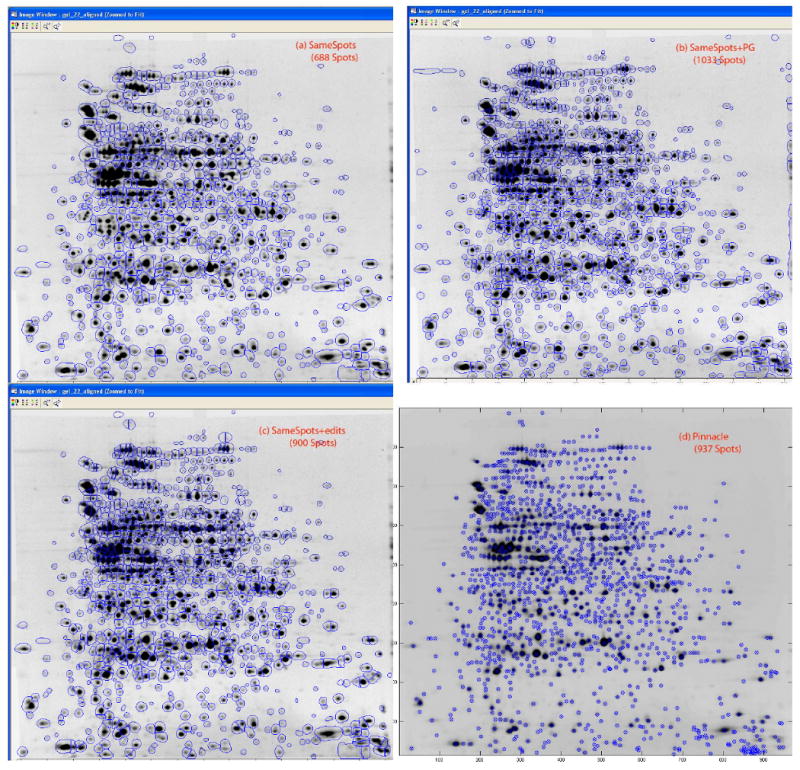
Figure 1. Spot Detection, NC Study.

Results of spot detection on Nishahara and Champion study for (a) SameSpots, (b) SameSpots with PG spot detection, (c) SameSpots with manual editing, and (d) Pinnacle. For (a)-(c), the image is from gel 22; spots are marked by their estimated boundaries. For (d), the image is the average gel used for spot detection; pinnacles for detected spots are marked by a circled x.
