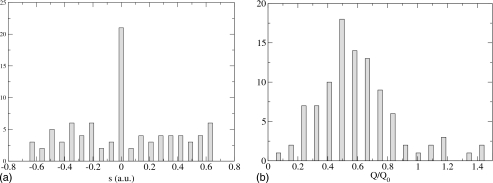
Figure 1.
Histograms for H tunneling, slow Q oscillation. Left, the histogram for s is peaked at the top of the symmetric double well. Right, the histogram for Q∕Q0 (Q0 is the location of the classical transition state, so a classical-like dynamics corresponds to a histogram peaked at (1). The system corner cuts before it reaches the classical transition state.

