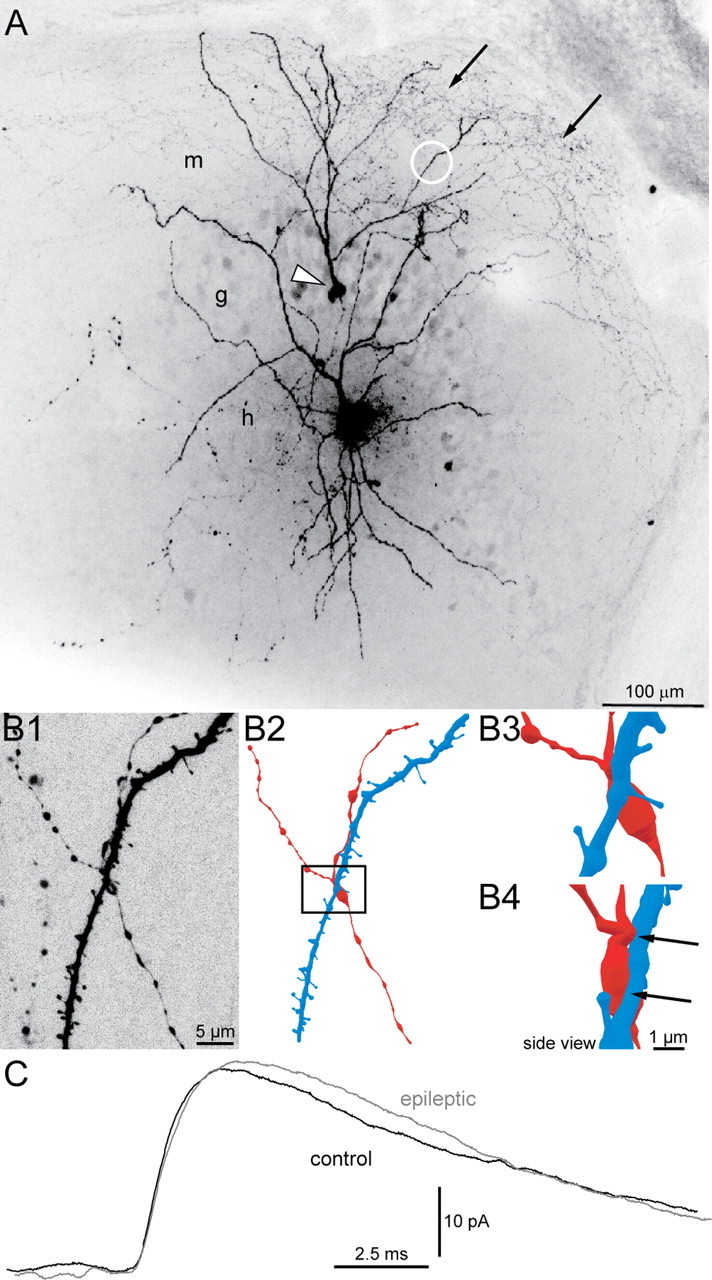
Figure 3.

uIPSCs recorded in granule cells and generated by green fluorescent protein-positive hilar somatostatin interneurons in slices from control and epileptic pilocarpine-treated GIN mice. A, A biocytin-labeled interneuron in the hilus (h) and granule cell (arrowhead) in a slice from an epileptic mouse. The interneuron's axon (arrows) is concentrated in the molecular layer (m). g, Granule cell layer. B, An apposition of the interneuron's axon and the granule cell's dendrite. B1, High-magnification view of the region indicated by the white circle in A showing the spiny granule cell dendrite and interneuron axon with varicosities. B2, Reconstruction of the granule cell dendrite (blue) and interneuron axon (red). B3, High-magnification view of the area in the rectangle in B2. B4, Side view with axon-dendrite appositions indicated by arrows. C, Average uIPSCs from a control (black) and epileptic mouse (gray).
