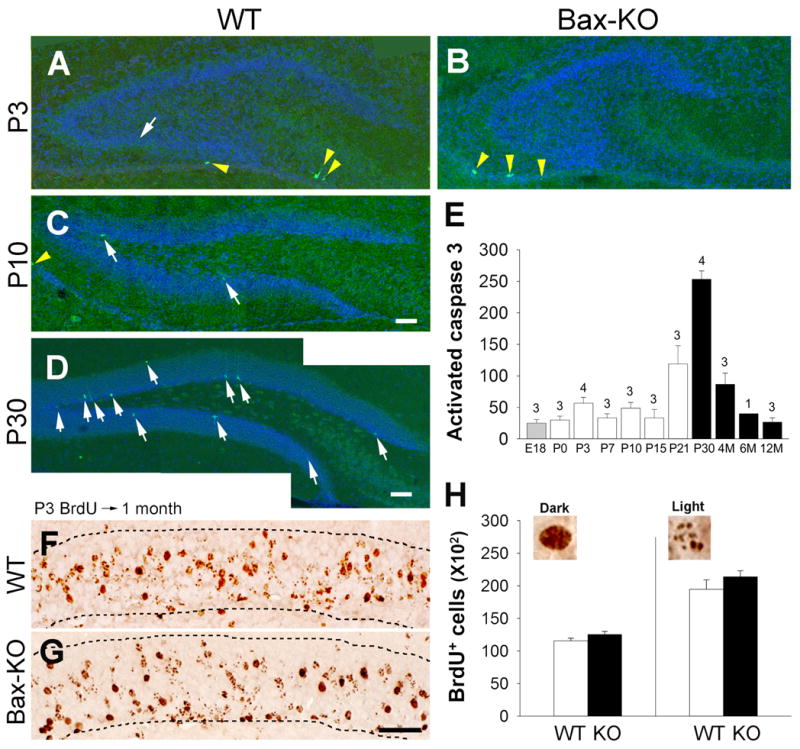
Fig. 1.

The PCD of developmentally produced DG neurons in WT and Bax-KO mice. A–B: Activated caspase-3 (green) in P3 (A, B), P10 (C), and P30 (D) WT (A,C,D) and Bax-KO (B) mice. Nuclei were counter-stained with Hoechst33342 (blue). White arrows indicate activated caspase3-labeled cells in the DG. Yellow arrowheads indicate activated caspase3-labeled cells in the paraventricular region surrounding hippocampal formation. Scale bar=100 μm E: Quantification of activated caspase-3-labeled cells in the WT DG. Note that activated caspase3-labeled dying cells are substantially increased after the major developmental neurogenic period (filled bars). Data=mean± s.e.m. The number of animals used in each group is shown over each bar. F–G: Survival (1-month) of P3-born BrdU-labeled cells in WT (F) and Bax-KO mice (G) DG. Animals received BrdU (50 mg/kg) on P3, and total number of BrdU-labeled cells in the DG was assessed 1 month later. Dashed lines indicate the borders of the GCL. Note that many neurons exhibited punctate-like nuclear BrdU-labeling, owing to the dilution of BrdU during additional rounds of cell division. H: Quantification of BrdU-labeled cells in the DG. We separately quantified dark-labeled, and punctate/light-labeled BrdU-positive nuclei within the GCL. Typical examples of each category are shown at the top of the graph. Data=mean± s.e.m., n=3.
