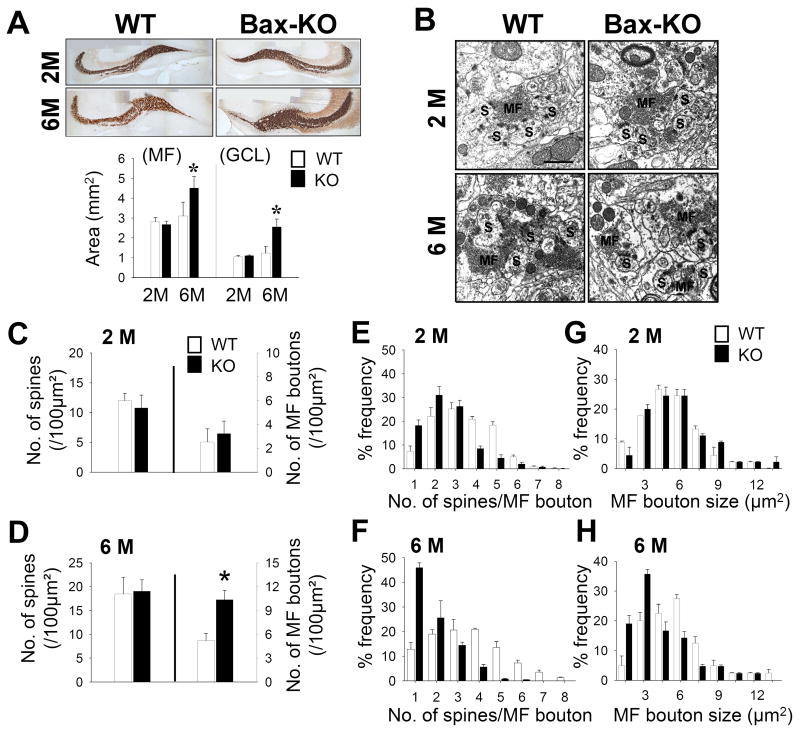
Fig. 3.
Histological analyses of MF connections. A: Timm’s staining revealed MF labeling in 2-month old and 6-month old WT and Bax-KO mice. Scale bar = 300 μm. Quantification of the MF and granule cell layer of DG areas (n=4, *p<0.05, t-test) is presented in the graph (bottom). B: Electron microscopic images of MF:CA3 synapses in 2-month old and 6-month old mice. MF boutons are labeled as MF, and postsynaptic density (PSD)-containing CA3 spines are labeled as S. Scale bar=1 μm. C–D: Density of spines and MF boutons in 2-month old (C, n=5 in WT, n=4 in KO) and 6-month old (D, n=4 in WT, n=5 in KO) groups. MFs contacting dendritic spines containing a PSD were included in the counts (*p<0.05, t-test). E–H: Frequency-fractionation analyses of the MF:CA3 ratio in 2-month old (E) and 6-month old (F) mice. Frequency-fractionation analyses of the size of MF boutons in the 2-month (G) and 6-month old groups (H). Data are expressed as mean±s.e.m.

