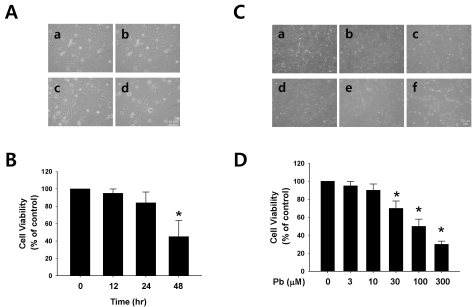
Fig. 1.
Effect of lead (Pb) on endothelial cell viability. (A) Typical endothelial cell morphology after treatment with Pb acetate (30 µM) for 12~48 hr (a, control; b, 12 hr; c, 24 hr; d, 48 hr). (B) Summarized data are plotted in Fig. 1B. (C) Typical endothelial cell morphology after treatment with Pb acetate for 24 hr. (a, control; b, 3 µM of Pb; c, 10 µM of Pb; d, 30 µM of Pb; e, 100 µM of Pb; f, 300 µM of Pb). (D) Summarized data was plotted in Fig. 1D. Total acetate concentration (300 µM) was balanced with Na acetate in Fig. 1C. Endothelial cell viability was measured via a MTT assay as described in the Materials and Methods section. The data are expressed as the means±SEM for 3 separate experiments. *p<0.05 compared with control.

