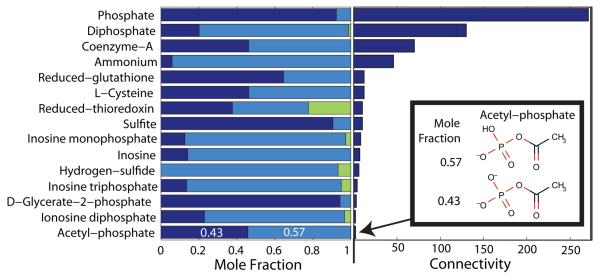
Figure 2. Non-predominant metabolite species.
At typical in vivo conditions, a minority of cytoplasmic reactants in E. coli (15/138 with available data), have significant mole fractions (> 0.05) present as non-predominant metabolite species. The length within each bar (left), apportioned to each color equals the mole fraction of the reactant present as a particular metabolite species. A bar with three colors indicates a reactant simultaneously present as three different metabolite species differing only in their state of protonation. Accurate prediction of standard transformed Gibbs energy of formation is especially important for reactants, such as Co-enzyme-A, which is almost equally present in the two different metabolites species forms, and participates as a reactant in many reactions (connectivity bar to the right). Another example is acetyl-phosphate which is also almost equally distributed, as C2H3O5P2− and C2H4O5P− (Inset). The mole fractions, corresponding to a pH 7.7 [43, 44], ionic strength 0.25 M and temperature 310.15 K, were calculated as described in Section 2.1.

