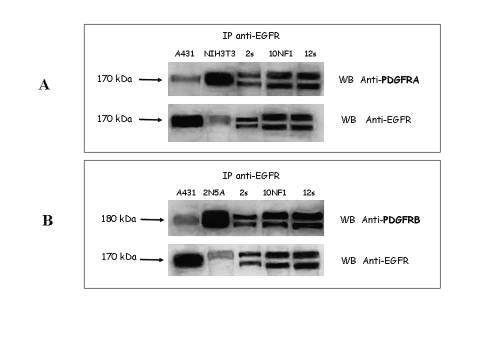
Fig. 2.
Epidermal growth factor receptor (EGFR)–platelet-derived growth factor (PDGF) receptor A (PDGFRA) and EGFR–PDGF receptor B (PDGFRB) heterodimerization. (A) EGFR immunoprecipitation (IP) and PDGFRA Western blotting (WB) experiments revealed a 170-kDa band corresponding to PDGFRA showing similar expression in all three analyzed cases (sporadic cases 2 [2s] and 12s and NF1-related case 10 [10NF1]). NIH3T3 cell lines were used as positive control for PDGFRA. Afterward, the filter was stripped and incubated with EGFR antibody, which revealed a band of 170 kDa in all of the analyzed samples, thus indicating less intense expression of EGFR than observed in the positive control A431 cells. (B) EGFR IP and PDGFRB WB experiments revealed a 180-kDa band corresponding to PDGFRB showing similar expression in all three analyzed cases (cases 2s, 10NF1, and 12s). 2N5A cell lines were used as positive control for PDGFRB. Afterward, the filter was stripped and incubated with EGFR antibody, which revealed a band of 170 kDa in all of the analyzed samples, thus indicating the expression of EGFR.

