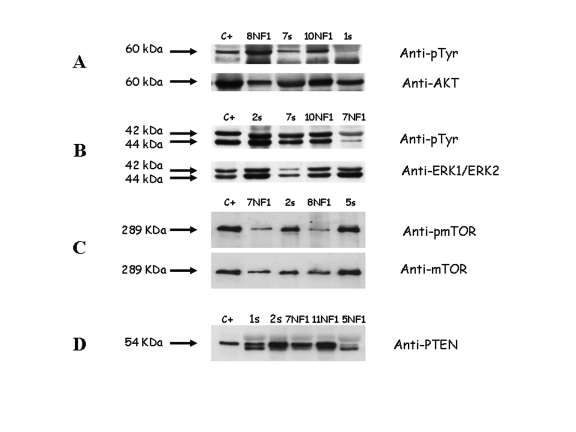
Fig. 3.
PTEN, AKT, ERK, and mTOR biochemical analysis. (A) Membrane incubation with phosphorylated Akt Ser 473 and anti-Akt polyclonal antibodies revealed a 60-kDa band corresponding to the activated (upper arrow) and expressed (lower arrow) Akt form. The samples showed phosphorylation levels similar to (NF1-related case 10 [10NF1]) or more (case 8NF1) or less (sporadic cases 7s and 1s) intense than 2N5A cells were used as positive controls. (B) Membrane incubation with both phosphorylated ERK and anti-ERK polyclonal antibodies revealed two bands of 42 and 44 kDa, corresponding to the ERK1 and ERK2 activated (upper arrow) and expressed (lower arrow) forms, respectively. ERK1 and ERK2 phosphorylation levels were similar to (cases 2s, 7s, and 10NF1) or less intense (case 7NF1) than those observed in the 2N5A cells used as positive controls. (C) Membrane incubation with phosphorylated mTOR and anti-mTOR polyclonal antibodies revealed a 289-kDa band corresponding to the activated (upper arrow) and expressed (lower arrow) mTOR form. Phosphorylation levels were similar to (cases 2s and 5s) or less intense (cases 7NF1 and 8NF1) than those observed in A431 cells used as positive control. (D) Membrane incubation with PTEN antibody revealed a 54-kDa band in all cases (cases 1s, 2s, 7NF1, and 11NF1) except in one case (case 5NF1) that showed reduced PTEN expression compared to A431 cell line used as positive control. C+, positive control.

