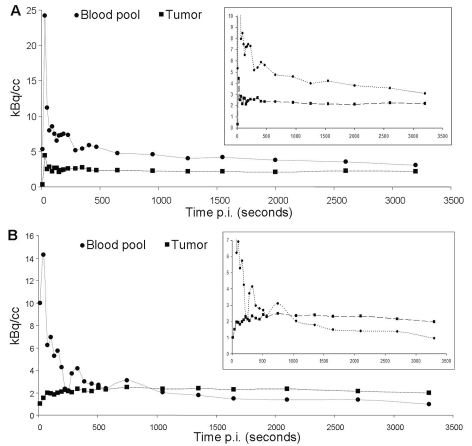
Fig. 2.
Examples of time–activity curves of patients with the lowest tumor uptake (A; maximum standardized uptake value [SUVmax], 0.8) and the highest tumor uptake (B; SUVmax, 2.8). Insets show the same curves with the y-axis expanded. Note the rapid tracer washout from blood pool in both scans. (A) Low tracer accumulation in the tumor that is always below the blood pool activity and follows the tracer concentration in the blood pool, with a rapid first peak followed by a slight decrease of tracer uptake. (B) Slow tracer accumulation over the first approximately 20 min, followed by a plateau phase that is above the level of blood pool activity, indicating specific tracer binding.

