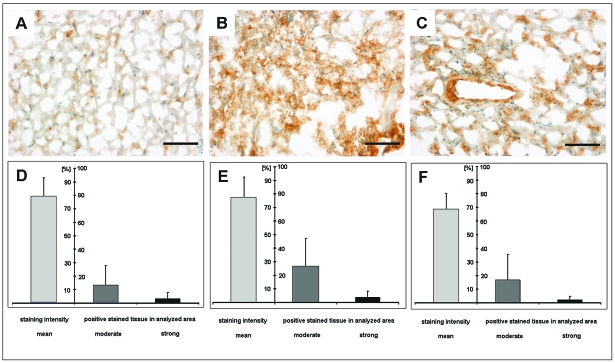
Fig. 4.
Immunohistochemistry (A–C) and statistical analysis of αvβ3 expression (D–F) within the different parts of the active tumor: center of the tumor (next to the tumor necrosis = zone A; A and D), the central part of the vital tumor (zone B; B and E), and the infiltrating zone (next to the normal brain tissue = zone C; C and F). (D–F) Mean staining intensities (indicated as percentage of positive control [M21 set to 100%]) as well as the fraction of moderately or strongly stained αvβ3-positive tissue within the tumor probes (percentage of the analyzed area). This subanalysis confirmed that the integrin expression is most prominent in the most active (central) part of the vital tumor (zone B; B and E). Scale bars, 100 μm for A–C.

