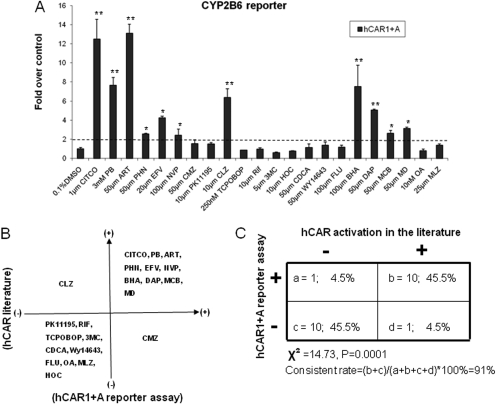
Fig. 3.
Correlation of the chemical specificity between the activation of hCAR1+A and hCAR1. A, HepG2 cells were transfected with CYP2B6-PBREM reporter, and hCAR1+A expression vectors. Transfected cells were then treated with vehicle control (0.1% DMSO), known hCAR activators (CITCO, PB, ART, PHN, EFV, NVP, CMZ, BHA, DAP, MCB, and MD), hCAR deactivators (CLZ, PK11195, OA), selective rodent CAR activator and/or CYP2B inducers (TCPOBOP, MLZ, and FLU), or prototypical activators of other nuclear receptor (RIF, 3MC, HOC, CDCA, and WY-14643) at indicated concentrations for 24 h. Luciferase activities were determined and expressed relative to vehicle control. Data represent the mean ± S.D. (n = 3) (*, p < 0.05; **, p < 0.01). B, hCAR1+A activation data and published hCAR1 data are organized in four-quadrant diagram. C, the correlation between hCAR1+A activation and published findings of hCAR1 activation was analyzed by χ2 test.

