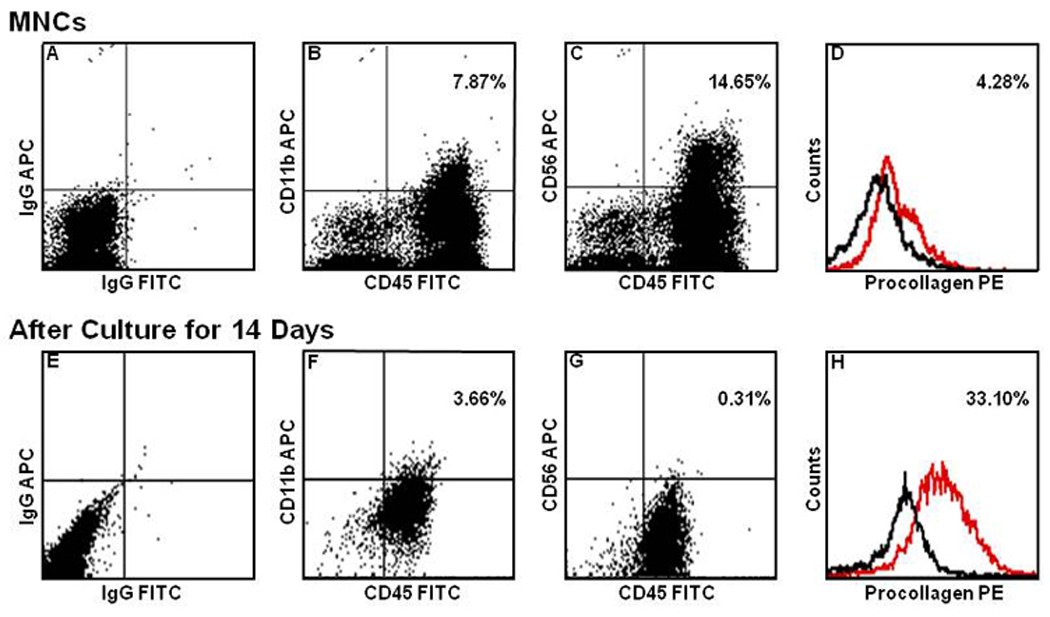
Figure 2. Flow cytometric analysis of PB MNCs and cultured fibroblasts.

Scales in the abscissa of all Panels were adjusted to isotype controls (Panels A, E and black lines in Panels D and H) and the relative fluorescence intensity of the data is expressed in logarithmic scales. The number of cells expressing CD11b (Panels B and F) and CD56 (Panels C and G) decreased and the intensity of CD45 expression weakened following culture. In contrast, the number of cells expressing pro-collagen-I (red lines in Panels D and H) increased with culture.
