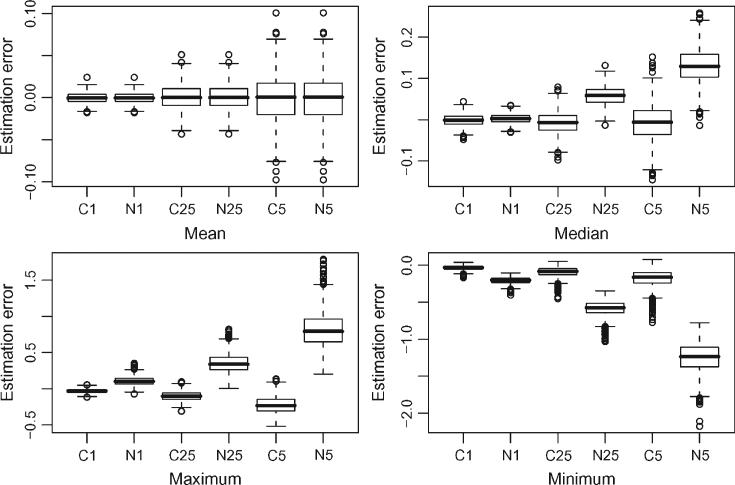
Figure 5.
Comparing the estimation error of functional features using the smoothing method described in Section 4 (solid line) with the naive approach (dashed line) that uses the observed data instead of the smooth data for feature extraction. In each panel, the amount of noise increases from left to right from 0.1 to 0.25 to 0.5. The letters C and N identify feature extraction based on smoothing and data, respectively, whereas the digits correspond to the amount of noise.

