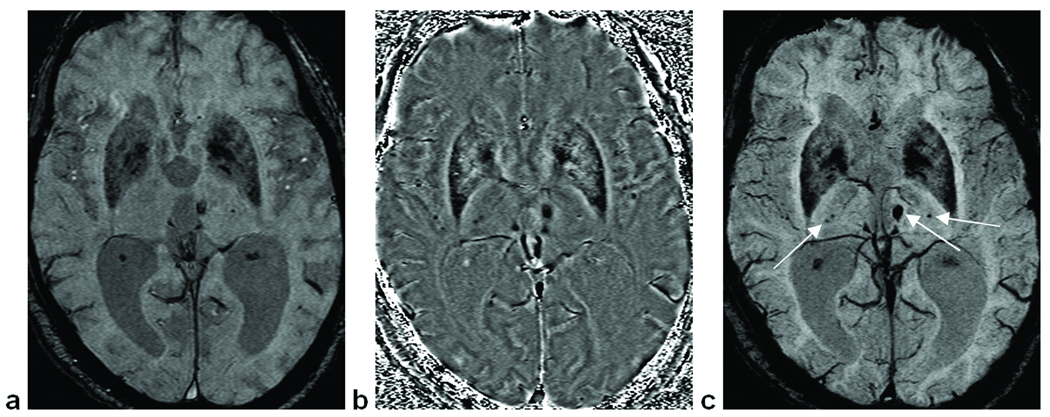
Figure 2.
Images used for the evaluation of microbleed counts. (a) Original magnitude image. (b) SWI high pass filtered phase image, which gives additional information compared to the original magnitude image. (c) SWI mIP over five slices (a product of combining magnitude and phase information), showing 4 deep CMBs.

