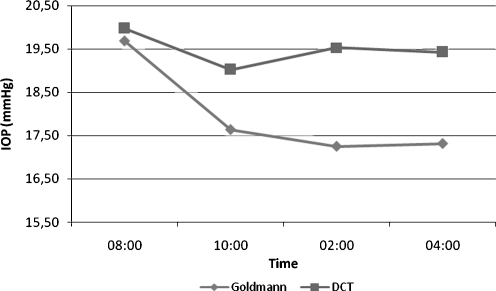
Fig. 3.
Mean intraocular pressure (IOP) profile during the modified diurnal tension curve (mDTC) using Goldman applanation tonometry (GAT) and dynamic contour tonometry (DCT). *Paired samples Student’s t test showed signifficant difference between morning (8 a.m.) and afternoon (2 and 4 p.m.) IOP measurements using GAT and DCT (p < 0.001). *Paired samples Student’s t test did not show significant differences between GAT and DCT IOP measurements at 8 a.m. (p = 0.54). At 10 a.m., the difference was significant (p < 0.001) and remained throughout the day

