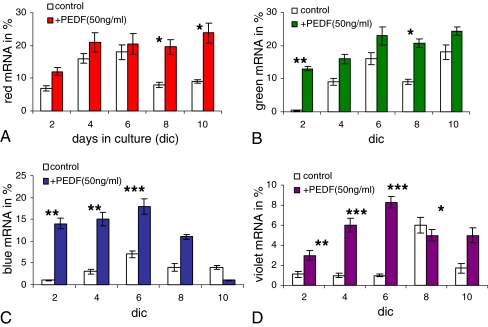
Fig. 6.
Quantification of mRNA levels from Fig. 5. The percentage of opsin mRNA was calculated in relation to expression of GAPDH mRNA. All opsins showed higher mRNA expression levels for PEDF-treated cultures. At days 8 and 10, the expression of red opsin remained over 20%, whereas in controls expression decreased to less than 10% (a). Controls and PEDF-treated cultures showed similar expression patterns for blue and green opsin (b vs. a), but note the different expression intensities for blue and violet opsins (c, d). Both blue and violet opsin mRNAs showed very different expression patterns and higher intensities after PEDF treatment. *P < 0.01; **P < 0.001; ***P < 0.0001

