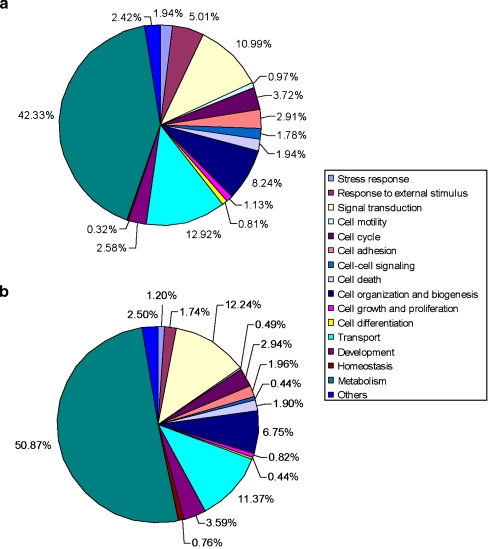
Fig. 3.
GO comparison between changed and unchanged gene groups. GO comparisons in all genes between changed (a) and unchanged (b) gene groups: The GO functional subgroups of the annotated genes were very similar between changed and unchanged gene groups, except the response to external stimulus and cell–cell signaling groups

