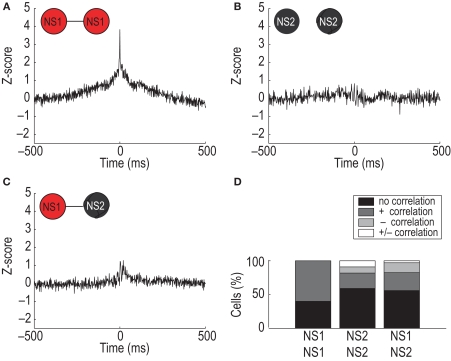
Figure 5.
Cell-type specific interneuronal network interactions. (A) Average CCH for pairs of simultaneously recorded NS1 neurons showing a significant increase in correlated firing [x-axis: time lag of correlation (ms); y-axis: correlation value relative to baseline]. (B,C) Flat CCHs for populations NS2–NS2 and NS1–NS2, respectively, indicate a lack of synchronous firing. (D) Percentage of cell pairs exhibiting positive (+), negative (−), mixed (+/−), or flat cross-correlation histograms. Criteria for significance was at least one bin within ±5 ms of the zero bin exceeding three standard deviations in either the positive or negative direction.

