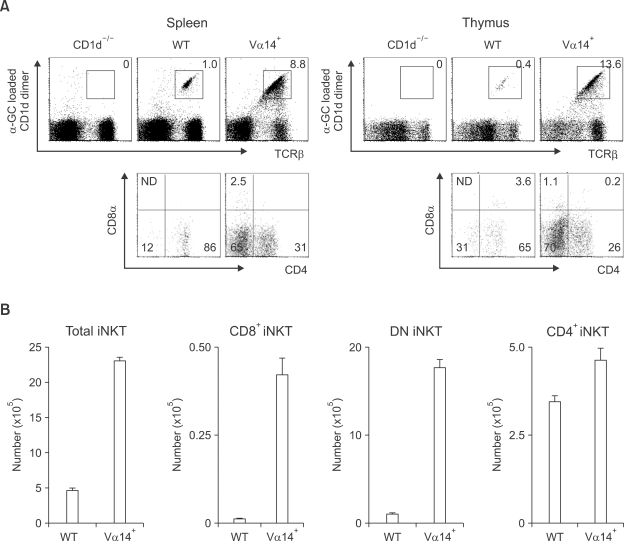
Figure 1.
The Existence of CD8+ invariant NKT cells in Vα14+ mice. The size of the iNKT cell population (A) in the spleen and thymus from the indicated mice were analyzed as described in Methods. The numbers in the dot plot indicate the percentage of each cell population. Lower panels show the CD4 and CD8 phenotypes of TCRβ+CD1d/α-GalCer dimer+ cells in each mouse. (B) The absolute number of each iNKT cell subtype in the spleen. Numbers represent mean value ± SD per spleen. ND means not detected.

