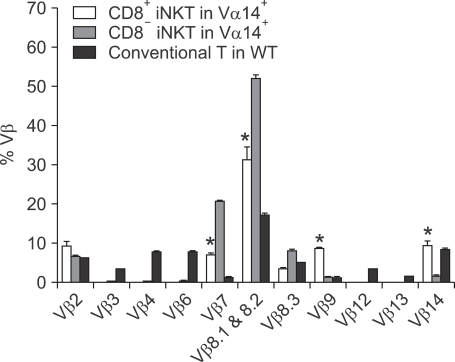
Figure 2.
TCR Vβ usage of CD8+ invariant NKT cells in Vα14+ mice. Splenocytes from the indicated mice were stained with CD1d/α-GalCer dimer and mAbs against TCRβ, CD8α and the Vβ TCR screening panel. The bar chart shows the mean percentage of each subtype of Vβ positive T cells (± SD) among the indicated cells. The percentages represent mean value ± SD per spleen.

