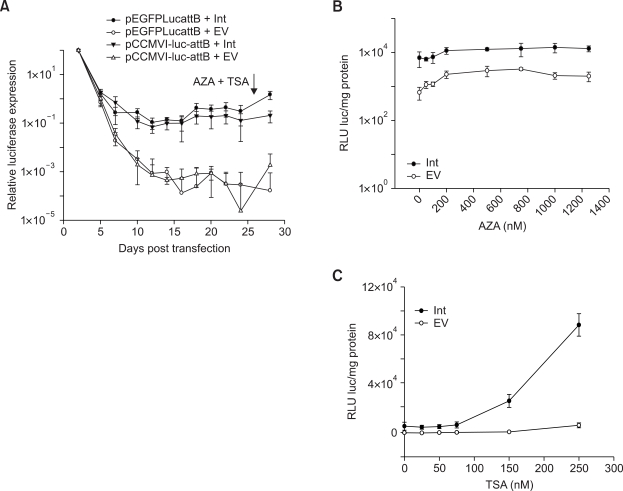
Figure 6.
No effect of bacterial backbone on the long-term expression values observed in A549 cells after φC31 integrase mediated integration. Constructs used have been schematically presented as Figure 5A. (A) A549 cells were transfected either with pEGFPLucattB ± pVAX1-Int or pCCMVI-luc-attB ± pVAX1-Int. AZA and TSA were added at 26 days post transfection. Luciferase activity was measured at different time points. Long-term expression results are expressed as percentage of luciferase values two days after transfection. (B) A549 cells were transfected with pEGFPLucattB ± pVAX1-Int. Increasing concentrations of AZA were added at 26 days post transfection and luciferase measurements made 48 h subsequently. (C) A549 cells were transfected with pEGFPLucattB ± pVAX1-Int. Increasing concentrations of TSA were added at 26 days post transfection and luciferase measurements made 48 h subsequently. Each transfection was repeated twice with two independent replicates per experiment. Values represent mean ± standard deviation (n = 4). Int: Integrase construct; EV: pVAX1 used as vector control.

