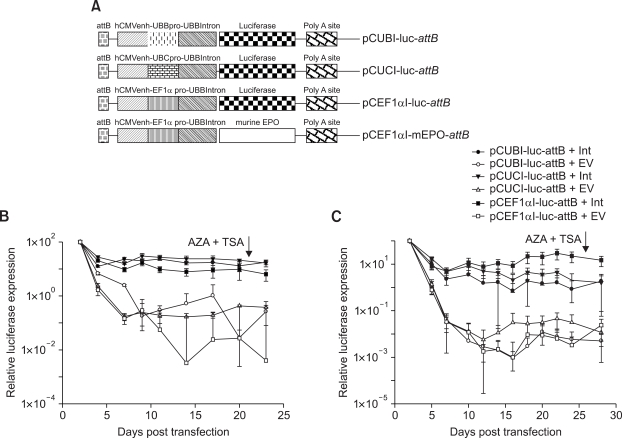
Figure 7.
(A) Schematic representation of donor plasmids with cellular promoters used in this study. Cellular promoters are resistant to DNA methylase and HDAC mediated silencing in MLE12 (B) and A549 (C) cells. Cells were transfected with each of the different donor plasmids ± pVAX1-Int. AZA and TSA were added at 21 days (MLE12) or 26 days (A549) post transfection. Luciferase activity was measured at different time points. Long-term expression results are expressed as percentage of luciferase values two days after transfection. Each transfection was repeated twice with two independent replicates per experiment. Values represent mean ± standard deviation (n = 4). Int: Integrase construct; EV: pVAX1 used as vector control.

