
Fig. 1.
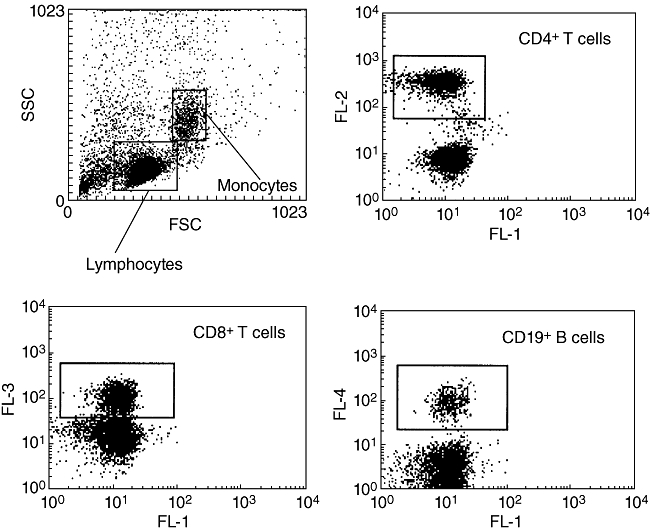
Representative do plot analysis of flow cytometry showing the respective gating for monocytes and lymphocytes, CD4+ T lymphocytes [FL2: phycoerythin (PE)-CD4], CD8+ T lymphocytes [FL3: peridinin chlorophyll protein (PerCp)-CD8] and CD19+ B lymphocytes (FL4: allophycocyanin (APC)-CD19].