
Figure 5. Apoptosis assessment.
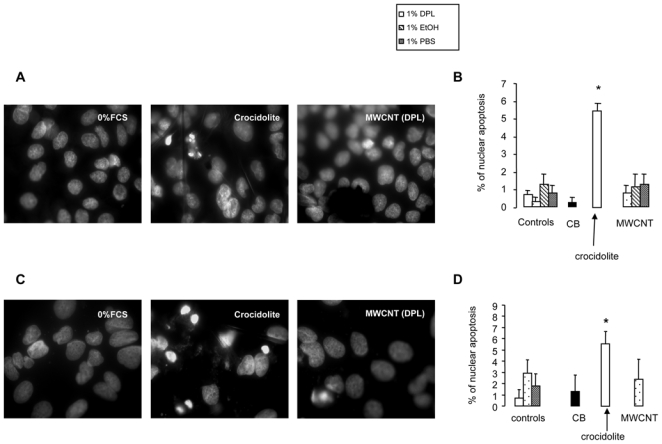
Panels A and B. Representative microscopic images of A549 cells (Panel A) and quantification of DAPI-positive cells (Panel B), after exposure of cells to 100 μg/ml nanomaterials for 72 hr.
Panels C and D. Representative microscopic images of MeT5A cells (Panel C) and quantification of DAPI-positive cells (Panel D), after exposure of cells to 100 μg/ml nanomaterials for 72 hr. Magnification x60. *p<0.05 vs control.