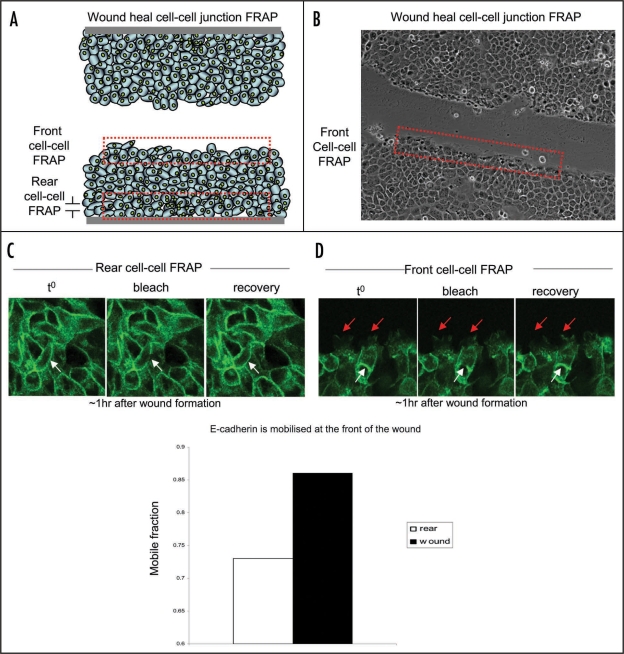
Figure 2.
FRAP of GFP-E-cadherin at the rear or front of a wound heal assay. (A and B) Schematic and representative images of a wound heal assay depicting the area of cells selected for E-cadherin-based cell-cell junction FRAP analysis (red broken line). (C and D) Representative images of FRAP experiments performed at the rear or front of a wound heal assay respectively. White solid arrows represent area of photobleaching at the rear and white broken arrows represent area of photobleaching at the front of the wound. Red arrows indicate dynamics of cells at the front of the wound. Cells were classed to be at the front of the wound within the first three cells from the wound border (reviewed in ref. 20).

