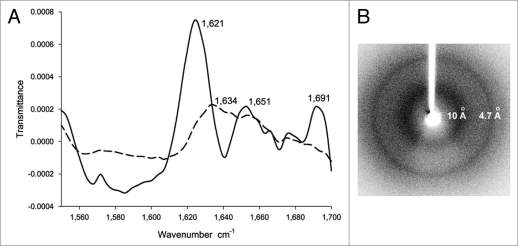
Figure 3.
(A) The FTIR spectrum of inclusion bodies of VP1LAC (continuous line) and soluble VP1LAC (broken line). VP1LAC stays in the soluble cell fraction as well as in inclusion bodies when produced in E. coli. (B) The X-ray diffraction of inclusion bodies of ESAT-6. (Partial reproduction of Figs. 8,39 and 2,52).

