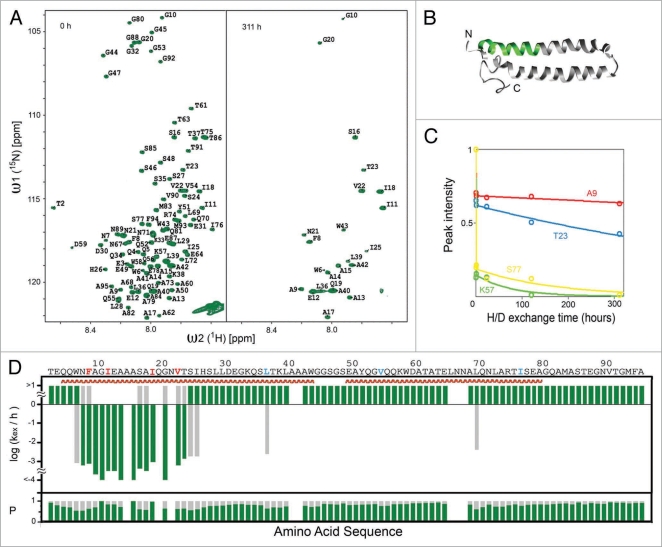
Figure 4.
Residues 7–23 of ESAT-6 form cross-β structure in inclusion bodies (A) [15N,1H]-HMQC-spectra of dissolved monomeric ESAT-6 inclusion bodies before (left) and after (right) exchanged in D2O buffer for 311 hours. (B) Ribbon representation of the 3D structure of soluble ESAT-6, while in complex with CFP-10 (not shown).64 The green-colored segment corresponds to residues 7–23. (C) NMR H/D-exchange curves for residues A9, T23, K57 and S77 of ESAT-6. The peak intensities for each residue were plotted versus the H/D exchange time. (D) H/D-exchange rates kex/h, and the relative population P of the two exchange components against the amino acid sequence of ESAT-6. The exchange rates of the major population (p > 1/2) are colored green. If the minor population (p < 1/2) is present more than 1/3, the corresponding exchange rates are shown in grey. The secondary structures of the soluble conformation shown in (B) are highlighted in red. (Partial reproduction of Figs. 2 and S2,52).

