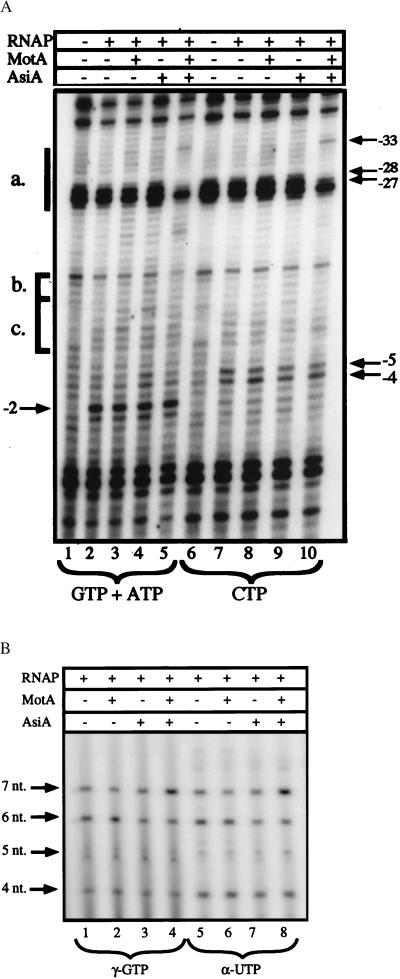
Figure 3.
Analysis of the RPO to RPinit transition by UV laser photofootprinting and in vitro abortive initiation assays. A shows the photofootprint of RNAP–PrIIB2 promoter complexes in the presence of either the initiating nucleotides GTP and ATP (lanes 1–5), which allow for the reiterative synthesis of a 3-nt product, or the nucleotide CTP (lanes 6–10), which should not be incorporated. The DNA was incubated for 15 min, either alone (lanes 1 and 6) or with the RNAP (lanes 2 and 7), in the presence of MotA (lanes 3 and 8), AsiA (lanes 4 and 9), and the two T4 proteins together (lanes 5 and 10). These complexes were challenged by heparin before the addition of the specified nucleotide(s), and the incubation was continued for 2 min. The samples were then irradiated and analyzed by primer extension on the NT strand. The Mot box (a.), extended −10 (b.), and −10 region (c.) are indicated as in Fig. 2. The positions of selected bands are marked by arrows. The abortive initiation products formed by the RPinit species are shown in B. Preformed complexes between PrIIB2 DNA (5 nM), RNAP (100 nM), and the T4 proteins (as indicated) were challenged by heparin, and supplied with selected NTPs. Lanes 1–4 received ATP and UTP at 200 μM, GTP at 100 μM, and 5 μCi of [γ-32P]GTP; lanes 5–8 received GTP and ATP at 200 μM, UTP at 25 μM, and 5 μCi of [α-32P]UTP. In both cases, this should allow for the synthesis of transcripts up to 7 nt in length, with the sequence 5′-GAGUUUA-3′. The position of each abortive product is shown by arrows.

