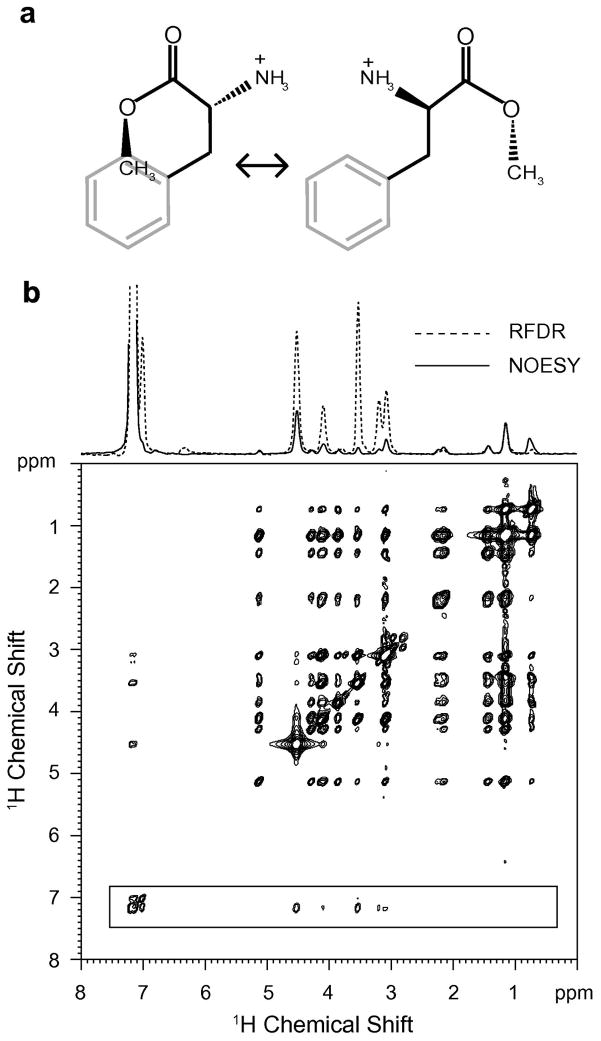
Fig. 8.
Molecular structure (a) and comparison of 1H MAS NOESY and 1H MAS RFDR spectra (b) of phenylalanine methyl ester bound to DMPC:DMPG bilayers. The 2D 1H MAS RFDR spectrum obtained with a 50 msec mixing time is shown. Above the spectrum are rows obtained through the aromatic protons of the phenylalanine ring comparing 1H MAS NOESY (solid line) with 1H MAS RFDR (dashed line) for the same mixing time and number of scans. For these experiments, the DMPC:DMPG molar ratio was 10:3 and the molar ratio of total lipid to phenylalanine methyl ester was 10:1.

