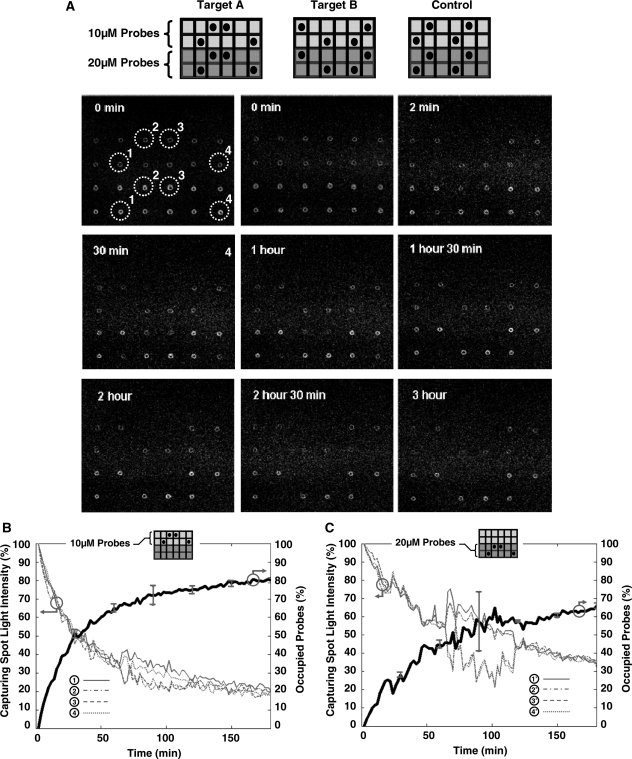
Figure 4.
Experimental results of a real-time DNA microarray system using Cy3 and BHQ2 as the donor and acceptor moieties according to method A of Figure 3. In (A), selected fluorescent images (every 30min) are shown during the first 3 h of the hybridization step when 20 ng/100 µl of Target A is introduced to the array. In (B), we show the time series acquired fluorescent light intensity and the calculated average percentage of the occupied probes for four identical capturing spots within this array which have Probe A printing concentration of 10 µM. In (C), we show similar data as of (B), but for capturing spots which have Probe A printing concentration of 2 µM.

