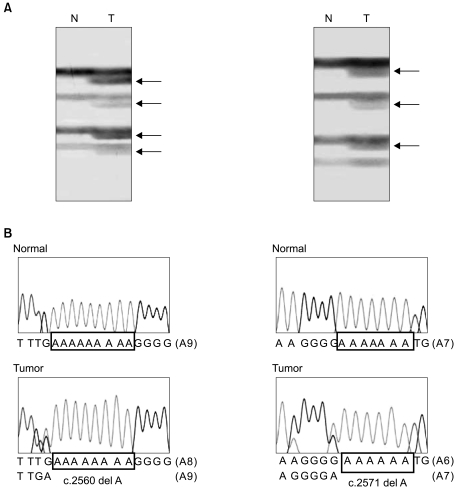
Fig. 1.
Representative SSCP and DNA sequencing of TTK mutations. SSCP (A) and DNA sequencing analysis (B) of TTK from tumor (Lane T) and normal tissues (Lane N) DNA. (A) In the SSCPs, the arrows (Lane T) indicate aberrant bands compared to the SSCP from normal tissues (N). (B) Direct DNA sequencing analyses of TTK show heterozygous deletions of one nucleotide in tumor tissue as compare to normal tissues.

