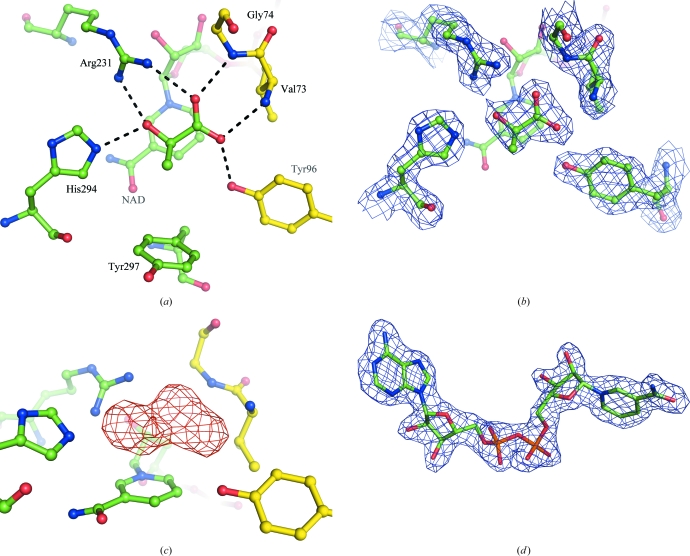
Figure 3.
(a) The active site of subunit A of A. aeolicus d-LDH (subunits B, C and D in the asymmetric unit were identical). (a) The orientation of the substrate bound in the cleft between the two domains, with the intermolecular contacts to the protein residues (length 2.7–2.9 Å) indicated by dashed lines. The catalytic domain is distinguished from the coenzyme-binding domain by having its C atoms coloured yellow. (b) The 2F o − F c electron-density map at the active site, contoured at the 1.2σ level. The electron density on the coenzyme has been omitted for clarity. (c) The F o − F c OMIT map at the active site showing electron density at the 3σ level with the substrate omitted from the model. (d) The quality of the 2F o − F c electron-density map for the NAD+ cofactor contoured at 1.2σ. The molecular-graphics figures were all obtained using PyMOL (DeLano, 2008 ▶).

