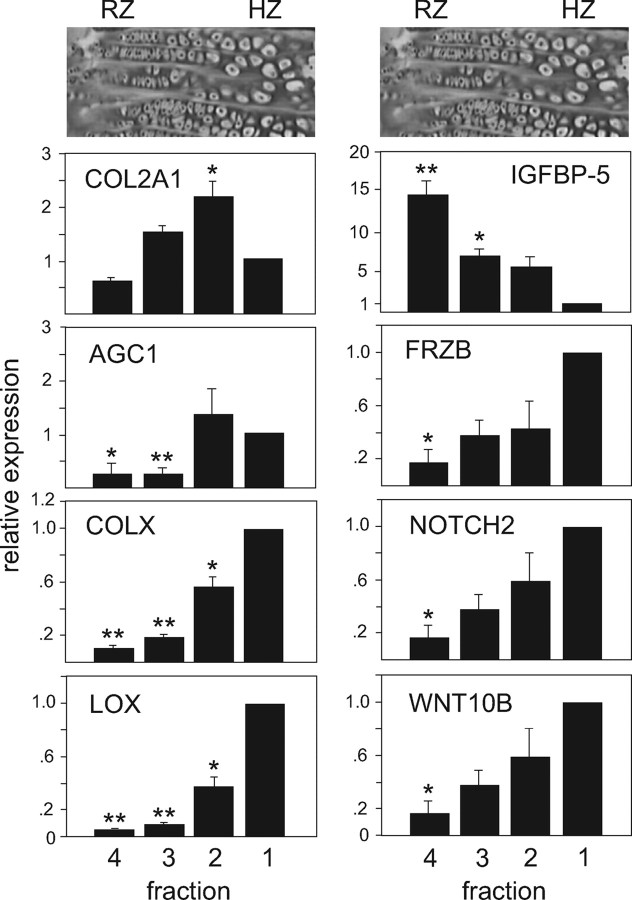
Figure 3.
Relative expression in bovine chondrocyte fractions of COL2A1, AGC1, and COLX as well as of selected differentially expressed transcripts identified by microarray: LOX, IGFBP-5, FRZB, NOTCH2, and WNT10B. Real-time RT-PCR was used to quantify mRNA levels of the marker proteins in the four density fractions of bovine growth plate chondrocytes. Data points were calculated using the ΔΔCt method and represent the mean ± se of real-time data from at least five separate chondrocyte preparations, expressed as fold difference from fraction 1 (the calibrator). Typical hematoxylin-eosin stains of bovine growth plate sections are aligned with the corresponding chondrocyte fraction. Note that y-axis scales are not identical. **, P < 0.001; *, P < 0.02 (compared with fraction 1).

