
Figure 7.
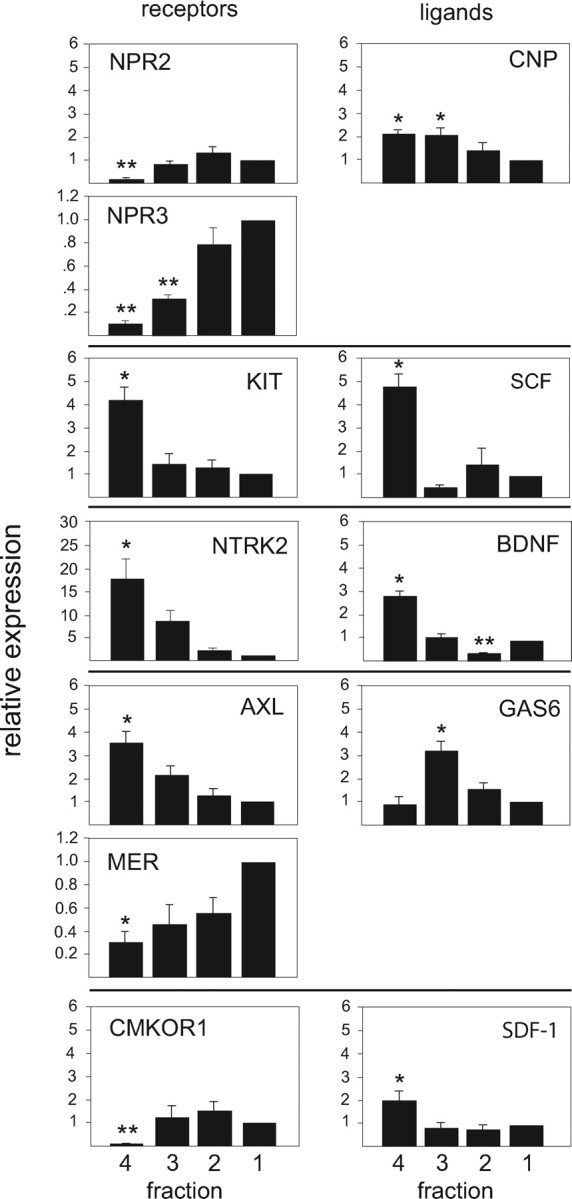
Relative expression in bovine chondrocyte fractions of cell surface receptors and their respective ligands identified by microarray. CNP and Gas6 each interact with two receptors; horizontal lines between panels delineate corresponding receptors and ligands. Real-time RT-PCR was used to measure relative mRNA levels in the four density fractions of bovine growth plate chondrocytes. Data points were calculated using the ΔΔCt method and represent the mean ± se of real-time data from at least five separate chondrocyte preparations, expressed as fold difference from fraction 1 (the calibrator). Note that y-axis scales are not identical. **, P < 0.001; *, P < 0.04 (compared with fraction 1).