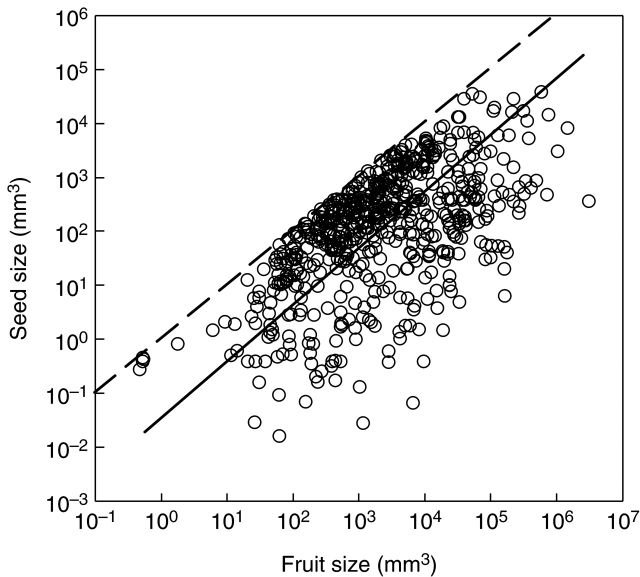
Fig. 1.
Relationship between seed size and fruit size among 622 woody species from Neotropical forests. Each data point represents the mean value for a species. Correlation statistics are given in Table 3. Standardized major axis (SMA) slope (and 95 % confidence interval): 1·05 (0·99, 1·12). The dashed line indicates the 1 : 1 physical constraint that seed size cannot be larger than fruit size.

